What Go Developers Should Know About Being Observed
Originally published in Japanese at https://zenn.dev/ymotongpoo/books/go-ebpf-primer/viewer/60-for_go_developers.
Everything so far has been about the side that writes OBI. For most Go developers, the realistic situation is the other one, where their own application stands on the observed side. How much of it gets instrumented depends on how you built the binary. Once you know what the four hurdles consist of, you can explain that difference for yourself.
Built with Go 1.17 or later
OBI’s support matrix states Go 1.17+ for library-level instrumentation. The dividing line is the version that switched to ABIInternal, the internal convention by which Go functions pass arguments. In offsets.json too, the standard-library entries that this book covers, such as net/http and bufio, list 1.17.0 as their oldest. The floor differs per feature, though. The goroutine parent-child propagation from Chapter 13 needs Go 1.18+: runtime.newproc1 in Go 1.17 takes the parent as its fourth argument, so the reading of GO_PARAM2 from Chapter 13 does not carry over as is.
The register ABI from Hurdle 2 is that same Go 1.17 change. To handle the older binaries that pass arguments on the stack, OBI would need a whole separate way to read them. Go 1.17 came out in August 2021, so this rarely becomes a problem in practice.
What happens with a stripped binary
Adding -ldflags="-s -w" to cut the distribution size is a common build setting. Chapter 4 listed the sections of an executable, and the commands below check which of them drop and which survive. The target is a small program that registers one net/http handler.
$ go build -o app main.go
$ go build -ldflags="-s -w" -o app_stripped main.go

$ ls -l app app_stripped | awk '{print $5, $9}'
5444719 app
3748002 app_stripped

$ readelf -S app         | grep -c debug_    # number of DWARF sections
8
$ readelf -S app_stripped | grep -c debug_
0

$ go tool nm app_stripped
reading app_stripped: no symbol section
reading app_stripped: no symbols

$ readelf -S app_stripped | grep -o gopclntab
gopclntab
DWARF, the debug information that holds types and field positions, is gone, and so is the symbol table. .gopclntab, the table that maps an instruction address to a Go function name, survives. The Go runtime itself needs that table to assemble a stack trace on panic, so -s -w does not drop it. The build info blob survives the same way, and go version -m keeps working.
OBI can still locate function addresses. go tool nm and go tool objdump need a symbol table and stop without one, but OBI depends on neither. pkg/internal/goexec/instructions.go parses .gopclntab on its own. runtime.moduledata has neither a symbol nor a fixed address, and the comment there describes the search: scan the binary for an 8-byte-aligned value that points at .gopclntab, then check whether the surrounding data matches the layout of moduledata. OBI is built so that it can work out where a function sits even without symbols.
What changes is the route by which OBI resolves offsets. As Hurdle 3 showed, OBI first tries to read the field offsets from the binary’s own DWARF. -w drops DWARF, so nothing remains to read, and OBI has to look up every entry in the offsets.json table. It stops reading the right answer written into the binary in front of it. It now hopes that a table prepared in advance covers its version. What deserves attention here is that a library version newer than the table does not make the lookup fail. The lookup walks the records from the newest down and returns the newest record at or below the target version, so a version past the end of the records gets the last value ever recorded. If the layout changed, the result of reading the wrong position rides into the trace looking correct. The symptom from Chapter 12, working plausibly without crashing, shows up right here. An entry goes missing only when the version is older than the first record, or when the field was never tracked at all.
Keeping DWARF makes instrumentation sturdier. Whether to add -w is a choice between the distribution size and the certainty of the instrumentation.
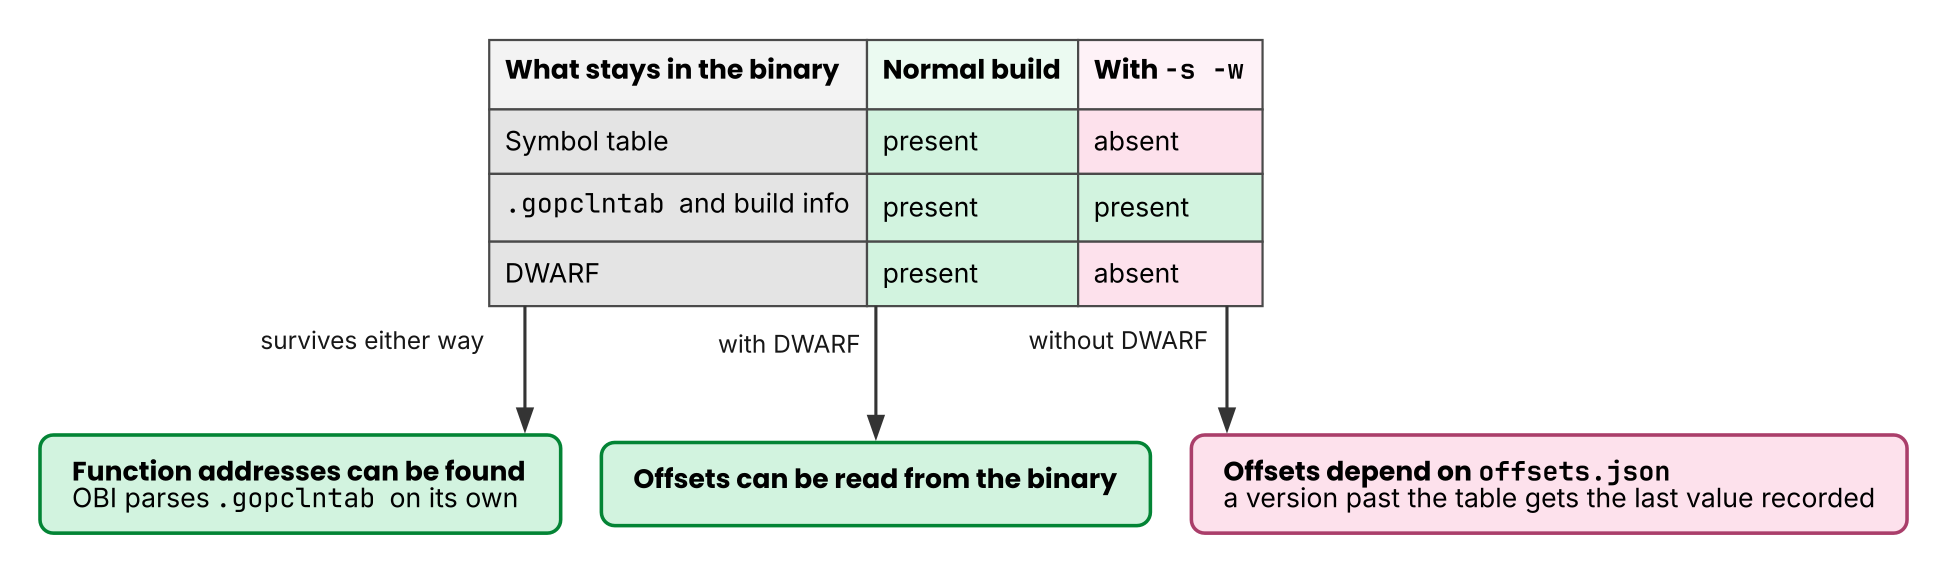 Figure 1: The arrows run from cause to effect, showing how what remains in the binary affects each part of instrumentation. Adding
 -s -w drops DWARF and the symbol table. .gopclntab survives, so OBI can still locate function addresses, but it resolves offsets from offsets.json alone. The lookup does not refuse a version missing from the table; it returns the newest record at or below that version.
Instrumentation points that vanish through inlining
As Chapter 5 showed, an inlined function loses the call instruction itself, so there is nowhere to place a uprobe. The smaller the accessor or the wrapper, the less instrumentation can see it.
OBI picks instrumentation points such as net/http.serverHandler.ServeHTTP and google.golang.org/grpc.(*Server).handleStream, which are large enough that the compiler does not inline them. When you write your own eBPF tool and aim at a particular function, check with -gcflags=-m whether the compiler inlined it.
The versions of your libraries
Hurdle 3 covered field offsets, and the other side of it is that the versions of your dependencies decide whether instrumentation works. If method names stopped appearing right after you upgraded gRPC, the cause may not be your application. offsets.json may not have caught up yet.
When traces do not appear, narrow the cause down in roughly this order.
- Does OBI detect the process?
- If it does, does it resolve the function addresses?
- If it does, are the field values that it reads plausible?
If you reach the last step and the values look wrong, suspect a gap in offset tracking.